“Mastering Data Visualization: A Step-by-Step Guide to Creating Professional Dashboards in Google Sheets and Excel”
“Mastering Data Visualization: A Step-by-Step Guide to Creating Professional Dashboards in Google Sheets and Excel”
Introduction
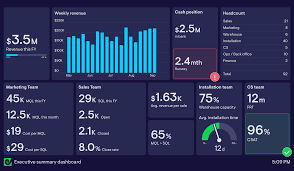
Professional dashboard is a powerful tool of data visualization used to track performance 📊 and make well-reasoned decisions 🧠. As either Google Sheets or Microsoft Excel can be used, constructing an effective dashboard entails the interplay between data organization, applying formulas, and visualization techniques 📈. This guide will walk you through developing a professional dashboard in Google Sheets or Excel, with significant principles, best practices, and sophisticated approaches.
Step 1: Planning Your Dashboard
Before you start working with Google Sheets or Excel, spend some time thinking through your dashboard. Ask yourself:
Professional Dashboard In Google Sheets Or Excel:- Budget Friendly Solution
- Purpose: What information do you want to monitor? What information should the dashboard show? 📋
- Audience: Who will be using the dashboard, and how much detail do they require? 👥
- Key Metrics: Determine the most important key performance indicators (KPIs) to include 📊.
- Data Sources: Where is your data located? Will you be importing data from an external source? 🌐
- Layout: Organize the dashboard in a logical and readable format so that it can be easily comprehended 🗂️.
Step 2: Gathering and Organizing Data
Efficiently organizing data is key to an effective dashboard.
Data Collection

- Google Sheets: Use built-in functions like IMPORTDATA, IMPORTRANGE, and QUERY to bring external data into it 🌍.
- Excel: Use Power Query, external data connections, and data import functions 📥.
Professional Dashboard In Google Sheets Or Excel:- Budget Friendly Solution
Structuring Data

- Put Raw Data, Calculations, and Dashboard Visualization in separate sheets 🗃️.
- Organize data in columns with proper headings 📑.
- Apply uniform data formatting (dates, money, percentages, etc.) 💰.
- Avoid typing in data; formulas and automated imports are better 🖥️.
Professional Dashboard In Google Sheets Or Excel:- Budget Friendly Solution
Step 3: Data Cleaning and Preparation
Good, accurate data is the basis for good insights 🔍.

- Eliminate Duplicates: Use Remove Duplicates in Excel or Google Sheets 🔄.
- Deal with Missing Data: Use IFERROR, IFNA, or conditional formatting to indicate issues ⚠️.
- Uniform Formats: Reformatted data into a standard format (e.g., YYYY-MM-DD for dates 📅).
- Sort and Filter Data: To make large data sets more accessible 📋.
Professional Dashboard In Google Sheets Or Excel:- Budget Friendly Solution
Step 4: Applying Formulas to Data Analysis
Formulas play a crucial role in data summarization and analysis 🧮.
- Basic Functions: SUM(), AVERAGE(), COUNT(), MIN(), MAX() ➕➖.
- Logical Functions: IF(), IFS(), AND(), OR() 🧠.
- Lookup Functions: VLOOKUP(), HLOOKUP(), INDEX-MATCH(), XLOOKUP() (Excel) 🔎.
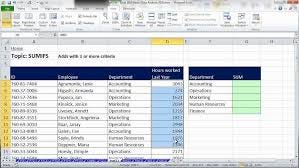
- Aggregations: SUMIF(), COUNTIF(), AVERAGEIF() 📊.
- Advanced Functions: ARRAYFORMULA() (Google Sheets), TEXTJOIN(), UNIQUE() 🔧.
Professional Dashboard In Google Sheets Or Excel:- Budget Friendly Solution
Step 5: Visualizations
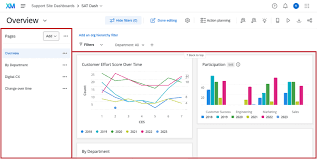
A professional dashboard relies on clear, informative visualizations 📈.

Charts and Graphs
- Column/Bar Charts: To compare categories 📊.
- Line Charts: Show trends over time 📅.
- Pie Charts: Show proportions 🍰.
- Scatter Plots: Show relationships between variables 🔗.
- Heat Maps: Use conditional formatting to highlight data trends 🌡️.
Professional Dashboard In Google Sheets Or Excel:- Budget Friendly Solution
Google Sheets Tools

- Use Data Validation to create dropdown menus 📝.
- Use Sparkline functions to create small charts in cells 📉.
- Use Google Data Studio for advanced reporting 📊.
Professional Dashboard In Google Sheets Or Excel:- Budget Friendly Solution
Excel Tools
- Use Pivot Tables for immediate data summarization 📋.
- Use Slicers for interactive filtering of data 🎮.
- Use Conditional Formatting to highlight key findings ⚡.
- Use Power BI for advanced visualization integration 📊.
Professional Dashboard In Google Sheets Or Excel:- Budget Friendly Solution
Step 6: Creating Interactivity

A business dashboard should allow users to interact with data 🔄.
- Dropdown Menus: Use Data Validation to specify selection fields 🗂️.
- Dynamic Charts: Use named ranges and dynamic formulas 🔁.
- Pivot Tables & Slicers: Allow users to dynamically filter data 📊.
- Checkboxes & Toggles: Create interactive controls for data ✔️.
Professional Dashboard In Google Sheets Or Excel:- Budget Friendly Solution
Step 7: Styling and Formatting
An attractively styled dashboard enhances usability 🎨.
- Use Consistent Colors: Implement a corporate color scheme 🎨.
- No Clutter: Leave tables and charts uncluttered ❌.
- Use White Space: Break sections into easier-to-read parts 📝.
- Label Everything Clearly: Label charts and tables with descriptive titles 🏷️.
Professional Dashboard In Google Sheets Or Excel:- Budget Friendly Solution
Step 8: Automating and Updating Data
Automation maintains your dashboard up-to-date 🔄.

- Google Sheets: Use IMPORTDATA(), GOOGLEFINANCE(), or App Scripts 🔧.
- Excel: Use Power Query, Macros, and Data Connections ⚙️.
- Scheduled Refreshes: Automate where possible 🔄.
Professional Dashboard In Google Sheets Or Excel:- Budget Friendly Solution
Step 9: Sharing and Collaboration

- Google Sheets: Use cloud sharing and permission features ☁️.
- Excel: Share using OneDrive or SharePoint 📤.
- Export Options: Provide PDF or CSV export for the reports 📄.
- Embedding: Embed dashboards in websites or presentations 🌐.
Professional Dashboard In Google Sheets Or Excel:- Budget Friendly Solution
Creating a professional dashboard in Google Sheets or Excel includes planning, data organization, using formulas, and visualization. In following these guidelines, you’ll be able to create an impactful and interactive dashboard that supports making data-driven decisions 💡. Whether it’s tracking business KPIs 📊, financial information 💰, or project metrics 📅, having a well-developed dashboard can be an immense asset for reporting and insights 🚀.


Comments
Post a Comment