🎨 “The Ultimate Guide to Eye-Catching Infographics: Designing Visuals That Captivate & Engage!”
🎨 “The Ultimate Guide to Eye-Catching Infographics: Designing Visuals That Captivate & Engage!”
📚 Introduction
With the accelerating pace of the world and declining attention spans, the internet is overflowing with content. 🎉 Infographics have emerged as a game-changing tool in the world of communication! 🌟 They don’t just provide detailed information in an engaging format but also help attract attention, enhance understanding, and boost engagement.
In this article, we will explore the art of creating interesting infographics, the design principles behind them, and the best practices to make your visuals shine! 🌈
Design Eye Capturing Infographics:- Budget Friendly Solution
✨ 1. What Are Infographics?
Before we dive into making infographics visually stunning, let’s understand what they are and their purpose.
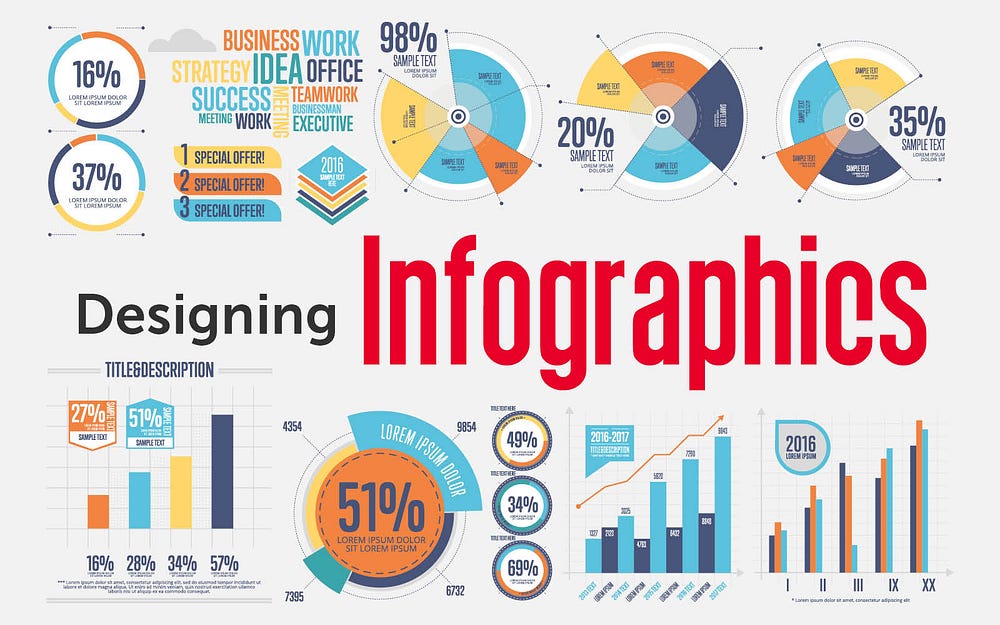
🌟 An infographic is a visual representation of information, knowledge, or data that simplifies complex concepts.
Infographics typically use:
- 🌀 Graphics & Images
- 📊 Charts & Graphs
- 📝 Icons & Text

Design Eye Capturing Infographics:- Budget Friendly Solution
👀 Types of Infographics
🎯 Statistical Infographics
📈 Uses pie charts, bar graphs, and numerical data to present statistics visually.
📖 Informational Infographics
📝 Breaks down concepts, ideas, or processes using icons and short text.
🕒 Timeline Infographics
📅 Showcases chronological developments of an event, product, or idea over time.
🎯 Comparative Infographics
🔄 Highlights similarities and differences between multiple items or ideas.
🔄 Process Infographics
💪 Illustrates step-by-step workflows and processes.

Design Eye Capturing Infographics:- Budget Friendly Solution
🔆 2. Why Are Eye-Capturing Infographics Important?

Design Eye Capturing Infographics:- Budget Friendly Solution
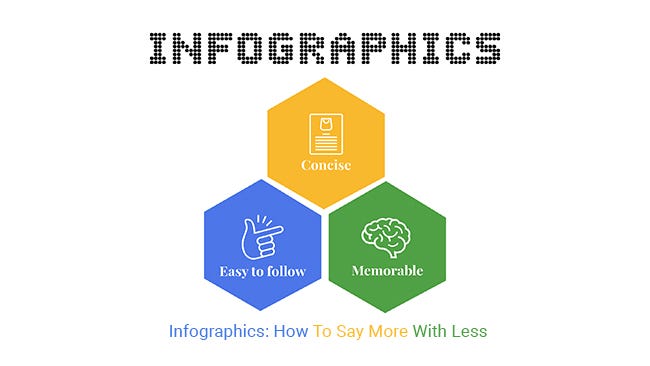
💥 Increased Attention: People engage more with visuals compared to plain text.
🤔 Improved Recall: The brain processes images faster than words, making information more memorable.
🔎 Simplifies Complexity: Breaks down intricate topics into easy-to-digest visuals.
🌐 Highly Shareable: Infographics tend to go viral on social media, increasing your reach.
💡 3. Most Critical Principles Behind Eye-Catching Infographics
Design Eye Capturing Infographics:- Budget Friendly Solution
🌟 3.1. Clarity and Simplicity
🎨 Less is More: Avoid clutter by using minimal but impactful visuals.
📊 Hierarchical Structure: Use bold colors and large fonts for key information.
📚 3.2. Strong Visual Storytelling
🎤 Tell a Story: Ensure a logical flow from start to finish. 🎉 Engagement through Narrative: People relate to visuals that create a journey.
🌈 3.3. Consistent Branding
💄 Brand Colors & Fonts: Make your infographic instantly recognizable. 💀 Subtle Logo Placement: Keep branding natural and non-intrusive.
📐 3.4. Accuracy of Data
🏆 Reliable Sources: Ensure all data is verified and credible. 📊 Proper Visualization: Use the right chart types for different data sets.
👀 3.5. Contrast and Readability
📝 Text Contrast: Use high contrast for easy readability. 🛏️ Spacing Matters: White space enhances clarity and prevents clutter.
👩🎨 4. Eye-Catching Infographic Designing Tools

Design Eye Capturing Infographics:- Budget Friendly Solution
💃 4.1. Canva
Easy-to-use design tool with ready-made infographic templates.
📚 4.2. Adobe Spark
Create infographics in minutes, including animated ones!
📈 4.3. Venngage
Great for professional-grade infographics with pre-designed themes.
🔄 4.4. Piktochart
Ideal for creating data-driven and statistical infographics.
🌐 4.5. Infogram
Powerful tool for interactive and animated infographics.
👀 5. Key Elements of an Eye-Catching Infographic

Design Eye Capturing Infographics:- Budget Friendly Solution
📊 5.1. Visual Hierarchy
Ensure the most critical information stands out using size and color.
📚 5.2. Typography
Choose readable fonts and vary sizes to differentiate headings.
🎨 5.3. Icons and Illustrations
Icons should be uniform and easy to recognize.
🌈 5.4. Color Scheme
Use contrast and complementary colors to enhance readability.
📊 5.5. Data Visualization
Choose the right graphs to represent data clearly.
🌟 6. Best Practices for Designing Eye-Catching Infographics

Design Eye Capturing Infographics:- Budget Friendly Solution
👩🎓 6.1. Know Your Audience
Tailor design and content to suit their expertise and interests.
👍 6.2. Keep It Simple
Don’t overload with information — break it into digestible pieces.
🎨 6.3. Utilize White Space
Avoid clutter to make your infographic easy to read.
📐 6.4. Be Consistent
Use a uniform style, color scheme, and font throughout.
📝 6.5. Focus on the Message
Design should enhance your message, not overshadow it.
🌐 7. How to Share and Promote Your Infographics

Design Eye Capturing Infographics:- Budget Friendly Solution
📲 7.1. Social Media
Post on Facebook, Instagram, LinkedIn, and Twitter for maximum engagement.
💻 7.2. Website and Blog
Host your infographic on your blog for easy access.
📧 7.3. Email Newsletters
Include infographics to boost email engagement rates.
🏆 7.4. Guest Posts & Collaborations
Partner with bloggers and influencers to expand reach.
Design Eye Capturing Infographics:- Budget Friendly Solution
💪 8. Conclusion
Infographics are a powerful asset for marketers, educators, and businesses. By blending simplicity, creativity, and data-driven design, you can create impactful visuals that engage audiences and convey information effortlessly.
💡 Apply the right design principles, tools, and best practices to create infographics that leave a lasting impression!
Comments
Post a Comment